Articles

Affichage des articles du novembre, 2022

Vibration d'une poutre simplement appuyée avec une masse concentrée au milieu

Image
Plusieurs méthodes sont utilisées pour trouver les modes propres d'une poutre simplement appuyée aux extrémités et ayant une masse concentrée au milieu. Les méthodes utilisées sont: La méthode analytique L'approximation par un système à un degré de liberté La méthode de Rayleigh La méthode de Dunkerley La méthode des éléments finis (version h)
حقيقة إعتناق مورغان فريمان الإسلامحقيقة إعتناق مورغان فريمان الإسلام

Image
تداول العديد من رواد مواقع التواصل الاجتماعي العديد من المنشورات التي تشير إلى إعتناق مورغان فريمان الإسلام عقب افتتاح كأس العالم 2022، نبين في هذا الفيديو زيف الخبر

Response of a damped mass spring system excited by various conditions on...

Image
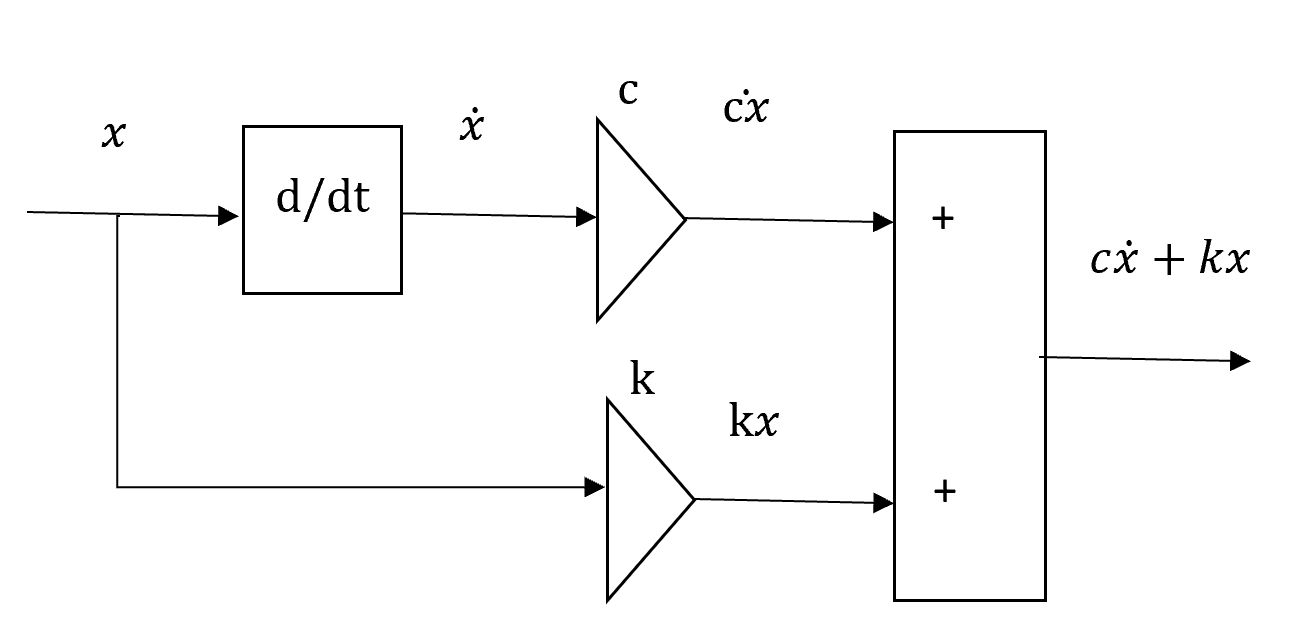
In this video, we will see how to find the response of a damped mass spring system excited by various conditions.   The governing equation is: md2x/dt^2+cdx/dt + kx=f Where m is the mass, c the viscous damping coefficient and k the spring stiffness. This gives the acceleration d2x/dt^2=(f - cdx/dt - kx)/m Using various blocks, we will build our model piece by piece. From a function x, we get dx/dt  by differentiating with respect to time . Then we multiply dx/dt  by c and x by k and sum the two expressions. Adding the external force and subtracting cdx/dt+kx  then dividing by m we should get the acceleration d2x/dt^2  which is also the result of differentiating dx/dt  with respect to time Working with integrators is better than with differentiator as in the former we could use the initial condition which gives better control on the solution obtained. The model becomes: On Simulink, we will need the following blocks: two integrators, 3 amp...

Solving differential equations on Simulink

Image
  Simulink capability of solving differential equations is put to the test. A simple equation with known solution is solved on Simulink.

Fractale de Newton sur Excel

Image
 Script VBA  Sub drawfractal() Dim c As Variant n = 201 xmax = 1.2 xmin = -1.2 ymax = 1.2 ymin = -1.2 For i = 1 To n     For j = 1 To n         c = WorksheetFunction.Complex((ymax - ymin) * (j - 1) / (n - 1) + ymin, (xmax - xmin) * (i - 1) / (n - 1) + xmin)         If c = WorksheetFunction.Complex(0, 0) Then         Else             Call iterate(c, Range("A1").Offset(i - 1, j - 1))         End If     Next Next End Sub Sub iterate(c As Variant, cel As Range) k = 1 cond = True Z0 = c While cond = True    Z = WorksheetFunction.ImSub(Z0, WorksheetFunction.ImDiv(WorksheetFunction.ImSub(WorksheetFunction.ImPower(Z0, 3), 1), WorksheetFunction.ImProduct(3, WorksheetFunction.ImPower(Z0, 2))))    If WorksheetFunction.ImAbs(WorksheetFunction.ImSub(Z, WorksheetFunction.Complex(1, 0))) < 0.001 Then         cond = False ...

Fractale de Newton sur Geogebra

Image
On génère la fractale de Newton sur Geogebra. La méthode de Newton Raphson est appliquée pour résoudre l'équation complexe Z^3-1=0. Les pixels sont coloriés en fonction de la solution finale obtenue en lançant la méthode à partir du pixel considéré comme nombre complexe

Fractale de Mandelbrot sur Excel

Image
Comment générer la fameuse fractale de Mandelbrot sur une feuille Excel Scripts VBA Sub drawMandelbrot() Dim c As Variant n = 201 xmax = 1.2 xmin = -1.2 ymax = 0.6 ymin = -1.5 For i = 1 To n     For j = 1 To n         c = WorksheetFunction.Complex((ymax - ymin) * (j - 1) / (n - 1) + ymin, (xmax - xmin) * (i - 1) / (n - 1) + xmin)         Call iterate(c, Range("A1").Offset(i - 1, j - 1))     Next Next End Sub Sub iterate(c As Variant, cel As Range) k = 1 cond = True Z = 0 While cond = True     'Zn+1=Zn^2+c     Z = WorksheetFunction.ImSum(WorksheetFunction.ImProduct(Z, Z), c)     If WorksheetFunction.ImAbs(Z) > 2 Then         cond = False     Else         k = k + 1     End If     If k > 255 Then         cond = False         cel.Interior.Color = vbBlack     End If Wend End Sub

Triangle de Sierpinski sur Excel

Image
Utiliser une feuille Excel pour générer le triangle de Sierpinski Vidéo sur @SparksMaths Code VBA Sub draw() Dim cel1 As Range Dim cel2 As Range Dim cel3 As Range Dim cel As Range Dim i As Integer Dim j As Integer Dim l As Single Dim Phi As Single Set cel1 = Range("A1") Set cel2 = Range("A1").Offset(0, 200) Set cel3 = Range("A1").Offset(100, 100) cel1.Interior.Color = vbRed cel2.Interior.Color = vbBlue cel3.Interior.Color = vbGreen Set cel = cel1.Offset(25, 100) cel.Interior.Color = vbBlack For i = 1 To 10000     j = Int((3 - 1 + 1) * Rnd() + 1)     Select Case j         Case 1             l = Sqr((cel1.Column - cel.Column) ^ 2 + (cel1.Row - cel.Row) ^ 2)             Phi = WorksheetFunction.Atan2((cel1.Column - cel.Column), (cel1.Row - cel.Row))         Case 2             l = Sqr((cel2.Column - cel.Column) ^ 2 + (cel2.Row - cel.Row) ^ 2) ...